The time for a host to be resolved to an IP address, usually by DNS resolution—a common source of performance issues.
Ping latency
The time from an ICMP echo request to a response. This measures the network and kernel stack handling of the packet on each host.
TCP connection initialization latency
The time from when a SYN is sent to when the SYN,ACK is received. Since no applications are involved, this measures the network and kernel stack latency on each host, similar to ping latency, with some additional kernel processing for the TCP session. TCP Fast Open (TFO) may be used to reduce this latency.
TCP first-byte latency
Also known as the time-to-first-byte latency (TTFB), this measures the time from when a connection is established to when the first data byte is received by the client. This includes CPU scheduling and application think time for the host, making it a more a measure of application performance and current load than TCP connection latency.
TCP retransmits
If present, can add thousands of milliseconds of latency to network I/O.
TCP TIME_WAIT latency
The duration that locally closed TCP sessions are left waiting for late packets.
Connection/session lifespan
The duration of a network connection from initialization to close. Some protocols like HTTP can use a keep-alive strategy, leaving connections open and idle for future requests, to avoid the overheads and latency of repeated connection establishment.
System call send/ receive latency
Time for the socket read/write calls (any syscalls that read/write to sockets, including read(2), write(2), recv(2), send(2), and variants).
System call connect latency
For connection establishment; note that some applications perform this as a non-blocking syscall.
Network round-trip time
The time for a network request to make a round-trip between endpoints. The kernel may use such measurements with congestion control algorithms.
Interrupt latency
Time from a network controller interrupt for a received packet to when it is serviced by the kernel.
Inter-stack latency
Time for a packet to move through the kernel TCP/IP stack.
On Linux systems, the network stack is a core kernel component, and device drivers are additional modules. Packets are passed through these kernel components as the struct sk_buff (socket buffer) data type. Note that there may also be queued in the IP layer (not pictured) for packet reassembly.
TCP Connection Queues
Bursts of inbound connections are handled by using backlog queues. There are two such queues, one for incomplete connections while the TCP handshake completes (also known as the SYN backlog), and one for established sessions waiting to be accepted by the application (also known as the listen backlog). These are pictured in Figure 10.9.
Figure 10.9 TCP backlog queues
Only one queue was used in earlier kernels, and it was vulnerable to SYN floods. A SYN flood is a type of DoS attack that involves sending numerous SYNs to the listening TCP port from bogus IP addresses. This fills the backlog queue while TCP waits to complete the handshake, preventing real clients from connecting.
With two queues, the first can act as a staging area for potentially bogus connections, which are promoted to the second queue only once the connection is established. The first queue can be made long to absorb SYN floods and optimized to store only the minimum amount of metadata necessary.
The use of SYN cookies bypasses the first queue, as they show the client is already authorized.
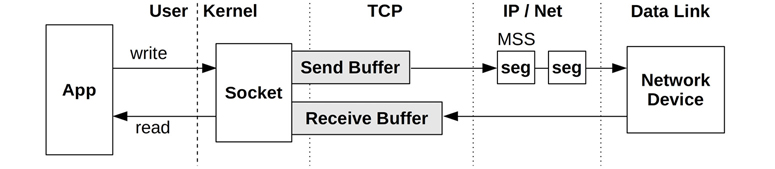
TCP Buffering
Data throughput is improved by using send and receive buffers associated with the socket. These are pictured in Figure 10.10.
Figure 10.10 TCP send and receive buffers
The size of both the send and receive buffers is tunable. Larger sizes improve throughput performance, at the cost of more main memory spent per connection. One buffer may be set to be larger than the other if the server is expected to perform more sending or receiving. The Linux kernel will also dynamically increase the size of these buffers based on connection activity and allows tuning of their minimum, default, and maximum sizes.
Segmentation Offload: GSO and TSO
Network devices and networks accept packet sizes up to a maximum segment size (MSS) that may be as small as 1500 bytes. To avoid the network stack overheads of sending many small packets, Linux uses generic segmentation offload (GSO) to send packets up to 64 Kbytes in size (“super packets”), which are split into MSS-sized segments just before delivery to the network device. If the NIC and driver support TCP segmentation offload (TSO), GSO leaves splitting to the device, improving network stack throughput. There is also a generic receive offload (GRO) complement to GSO. GRO and GSO are implemented in-kernel software, and TSO is implemented by NIC hardware.
CPU Scaling
High packet rates can be achieved by engaging multiple CPUs to process packets and the TCP/IP stack. Linux supports various methods for multi-CPU packet processing:
RSS: Receive Side Scaling: For modern NICs that support multiple queues and can hash packets to different queues, which are in turn processed by different CPUs, interrupting them directly. This hash may be based on the IP address and TCP port numbers, so that packets from the same connection end up being processed by the same CPU.
RPS: Receive Packet Steering: A software implementation of RSS, for NICs that do not support multiple queues. This involves a short interrupt service routine to map the inbound packet to a CPU for processing. A similar hash can be used to map packets to CPUs, based on fields from the packet headers.
RFS: Receive Flow Steering: This is similar to RPS, but with affinity for where the socket was last processed on-CPU, to improve CPU cache hit rates and memory locality.
Accelerated Receive Flow Steering: This achieves RFS in hardware, for NICs that support this functionality. It involves updating the NIC with flow information so that it can determine which CPU to interrupt.
XPS: Transmit Packet Steering: For NICs with multiple transmit queues, this supports transmission by multiple CPUs to the queues.
Optimizations
Pacing: This controls when to send packets, spreading out transmissions (pacing) to avoid bursts that may hurt performance (this may help avoid TCP micro-bursts that can lead to queueing delay, or even cause network switches to drop packets. It may also help with the incast problem, when many end points transmit to one at the same time).
TCP Small Queues (TSQ): This controls (reduces) how much is queued by the network stack to avoid problems including bufferbloat.
Byte Queue Limits (BQL): These automatically size the driver queues large enough to avoid starvation, but also small enough to reduce the maximum latency of queued packets, and to avoid exhausting NIC TX descriptors. It works by pausing the addition of packets to the driver queue when necessary, and was added in Linux 3.3.
Earliest Departure Time (EDT): This uses a timing wheel instead of a queue to order packets sent to the NIC. Timestamps are set on every packet based on policy and rate configuration. This was added in Linux 4.20, and has BQL- and TSQ-like capabilities
Reno: Triple duplicate ACKs trigger: halving of the congestion window, halving of the slow-start threshold, fast retransmit, and fast recovery.
Tahoe: Triple duplicate ACKs trigger: fast retransmit, halving the slow-start threshold, congestion window set to one maximum segment size (MSS), and slow-start state. (Along with Reno, Tahoe was first developed for 4.3BSD.)
CUBIC: Uses a cubic function (hence the name) to scale the window, and a “hybrid start” function to exit slow start. CUBIC tends to be more aggressive than Reno, and is the default in Linux.
BBR: Instead of window-based, BBR builds an explicit model of the network path characteristics (RTT and bandwidth) using probing phases. BBR can provide dramatically better performance on some network paths, while hurting performance on others. BBRv2 is currently in development and promises to fix some of the deficiencies of v1.
DCTCP: DataCenter TCP relies on switches configured to emit Explicit Congestion Notification (ECN) marks at a very shallow queue occupancy to rapidly ramp up to the available bandwidth (RFC 8257). This makes DCTCP unsuitable for deployment across the Internet, but in a suitably configured controlled environment it can improve performance significantly.
Sliding window: This allows multiple packets up to the size of the window to be sent on the network before acknowledgments are received, providing high throughput even on high-latency networks. The size of the window is advertised by the receiver to indicate how many packets it is willing to receive at that time.
Congestion avoidance: To prevent sending too much data and causing saturation, which can cause packet drops and worse performance.
Slow-start: Part of TCP congestion control, this begins with a small congestion window and then increases it as acknowledgments (ACKs) are received within a certain time. When they are not, the congestion window is reduced.
Selective acknowledgments (SACKs): Allow TCP to acknowledge discontinuous packets, reducing the number of retransmits required.
Fast retransmit: Instead of waiting on a timer, TCP can retransmit dropped packets based on the arrival of duplicate ACKs. These are a function of round-trip time and not the typically much slower timer.
Fast recovery: This recovers TCP performance after detecting duplicate ACKs, by resetting the connection to perform slow-start.
TCP fast open: Allows a client to include data in a SYN packet, so that server request processing can begin earlier and not wait for the SYN handshake (RFC7413). This can use a cryptographic cookie to authenticate the client.
TCP timestamps: Includes a timestamp for sent packets that is returned in the ACK, so that round-trip time can be measured (RFC 1323) [Jacobson 92].
TCP SYN cookies: Provides cryptographic cookies to clients during possible SYN flood attacks (full backlogs) so that legitimate clients can continue to connect, and without the server needing to store extra data for these connection attempts.
Interface: The term interface port refers to the physical network connector. The term interface or link refers to the logical instance of a network interface port, as seen and configured by the OS. (Not all OS interfaces are backed by hardware: some are virtual.)
Packet: The term packet refers to a message in a packet-switched network, such as IP packets.
Frame: A physical network-level message, for example an Ethernet frame.
Socket: An API originating from BSD for network endpoints.
Bandwidth: The maximum rate of data transfer for the network type, usually measured in bits per second. “100 GbE” is Ethernet with a bandwidth of 100 Gbits/s. There may be bandwidth limits for each direction, so a 100 GbE may be capable of 100 Gbits/s transmit and 100 Gbit/s receive in parallel (200 Gbit/sec total throughput).
Throughput: The current data transfer rate between the network endpoints, measured in bits per second or bytes per second.
Latency: Network latency can refer to the time it takes for a message to make a round-trip between endpoints, or the time required to establish a connection (e.g., TCP handshake), excluding the data transfer time that follows.
This section introduces memory architecture, both hardware and software, including processor and operating system specifics.
Hardware
Main Memory
The common type of main memory in use today is dynamic random-access memory (DRAM). This is a type of volatile memory—its contents are lost when power is lost. DRAM provides high-density storage, as each bit is implemented using only two logical components: a capacitor and a transistor. The capacitor requires a periodic refresh to maintain charge.
Latency
The access time of main memory can be measured as the column address strobe (CAS) latency: the time between sending a memory module the desired address (column) and when the data is available to be read.
Main Memory Architecture
Uniform Memory Access
Non-uniform memory access
Buses
Main memory may be accessed in one of the following ways:
Shared system bus: Single or multiprocessor, via a shared system bus, a memory bridge controller, and finally a memory bus.
Direct: Single processor with directly attached memory via a memory bus.
Interconnect: Multiprocessor, each with directly attached memory via a memory bus, and processors connected via a CPU interconnect.
Multichannel
System architectures may support the use of multiple memory buses in parallel, to improve bandwidth. Common multiples are dual-, triple-, and quad-channel.
CPU Caches
Processors typically include on-chip hardware caches to improve memory access performance. The caches may include the following levels, of decreasing speed and increasing size:
Level 1: Usually split into a separate instruction cache and data cache
Level 2: A cache for both instructions and data
Level 3: Another larger level of cache
Depending on the processor, Level 1 is typically referenced by virtual memory addresses, and Level 2 onward by physical memory addresses.
MMU
The MMU (memory management unit) is responsible for virtual-to-physical address translations. These are performed per page, and offsets within a page are mapped directly.
TLB
The MMU uses a TLB (translation lookaside buffer) as the first level of address translation cache, followed by the page tables in main memory. The TLB may be divided into separate caches for instruction and data pages.
Software
Freeing Memory
When the available memory on the system becomes low, there are various methods that the kernel can use to free up memory, adding it to the free list of pages.
Free list: A list of pages that are unused (also called idle memory) and available for immediate allocation. This is usually implemented as multiple free page lists, one for each locality group (NUMA).
Page cache: The file system cache. A tunable parameter called swappiness sets the degree to which the system should favor freeing memory from the page cache instead of swapping.
Swapping: This is paging by the page-out daemon, kswapd, which finds not recently used pages to add to the free list, including application memory. These are paged out, which may involve writing to either a file system-based swap file or a swap device. Naturally, this is available only if a swap file or device has been configured.
Reaping: When a low-memory threshold is crossed, kernel modules and the kernel slab allocator can be instructed to immediately free any memory that can easily be freed. This is also known as shrinking.
OOM killer: The out-of-memory killer will free memory by finding and killing a sacrificial process, found using select_bad_process() and then killed by calling oom_kill_process(). This may be logged in the system log (/var/log/messages) as an “Out of memory: Kill process” message.
Free List(s)
Reaping
Reaping mostly involves freeing memory from the kernel slab allocator caches. These caches contain unused memory in slab-size chunks, ready for reuse. Reaping returns this memory to the system for page allocations.
Page Scanning
Freeing memory by paging is managed by the kernel page-out daemon. When available main memory in the free list drops below a threshold, the page-out daemon begins page scanning. Page scanning occurs only when needed. A normally balanced system may not page scan very often and may do so only in short bursts. kswapd scans the inactive list first, and then the active list, if needed.
Process Virtual Address Space
Managed by both hardware and software, the process virtual address space is a range of virtual pages that are mapped to physical pages as needed. The addresses are split into areas called segments for storing the thread stacks, process executable, libraries, and heap.
Executable text: Contains the executable CPU instructions for the process. This is mapped from the text segment of the binary program on the file system. It is read-only with the execute permission.
Executable data: Contains initialized variables mapped from the data segment of the binary program. This has read/write permissions so that the variables can be modified while the program is running. It also has a private flag so that modifications are not flushed to disk.
Heap: This is the working memory for the program and is anonymous memory (no file system location). It grows as needed and is allocated via malloc(3).
Stack: Stacks of the running threads, mapped read/write.
Allocators
Slab
The kernel slab allocator manages caches of objects of a specific size, allowing them to be recycled quickly without the overhead of page allocation. This is especially effective for kernel allocations, which are frequently for fixed-size structs.
Slub
The Linux kernel SLUB allocator is based on the slab allocator and is designed to address various concerns, especially regarding the complexity of the slab allocator. Improvements include the removal of object queues, and per-CPU caches—leaving NUMA optimization to the page allocator
glibc
Its behavior depends on the allocation request size. Small allocations are served from bins of memory, containing units of a similar size, which can be coalesced using a buddy-like algorithm. Larger allocations can use a tree lookup to find space efficiently. Very large allocations switch to using mmap. The net result is a high-performing allocator that benefits from multiple allocation policies.
Following are some commonly mentioned memory related terminologies:
Main memory: Also referred to as physical memory, this describes the fast data storage area of a computer, commonly provided as DRAM.
Virtual memory: An abstraction of main memory that is (almost) infinite and non-contended. Virtual memory is not real memory.
Resident memory: Memory that currently resides in main memory.
Anonymous memory: Memory with no file system location or path name. It includes the working data of a process address space, called the heap.
Address space: A memory context. There are virtual address spaces for each process, and for the kernel.
Segment: An area of virtual memory flagged for a particular purpose, such as for storing executable or writeable pages.
Instruction text: Refers to CPU instructions in memory, usually in a segment.
OOM: Out of memory, when the kernel detects low available memory.
Page: A unit of memory, as used by the OS and CPUs. Historically it is either 4 or 8 Kbytes. Modern processors have multiple page size support for larger sizes.
Page fault: An invalid memory access. These are normal occurrences when using on-demand virtual memory.
Paging: The transfer of pages between main memory and the storage devices.
Swapping: Linux uses the term swapping to refer to anonymous paging to the swap device (the transfer of swap pages). In Unix and other operating systems, swapping is the transfer of entire processes between main memory and the swap devices. This book uses the Linux version of the term.
Swap: An on-disk area for paged anonymous data. It may be an area on a storage device, also called a physical swap device, or a file system file, called a swap file. Some tools use the term swap to refer to virtual memory (which is confusing and incorrect).
Virtual Memory
Virtual memory is an abstraction that provides each process and the kernel with its own large, linear, and private address space. It simplifies software development, leaving physical memory placement for the operating system to manage. It also supports multitasking (virtual address spaces are separated by design) and oversubscription (in-use memory can extend beyond main memory).
Paging
Paging is the movement of pages in and out of main memory, which are referred to as page-ins and page-outs, respectively.
File System Paging: File system paging is caused by the reading and writing of pages in memory-mapped files. This is normal behavior for applications that use file memory mappings (mmap(2)) and on file systems that use the page cache Anonymous Paging (Swapping): Anonymous paging involves data that is private to processes: the process heap and stacks. It is termed anonymous because it has no named location in the operating system (i.e., no file system path name). Anonymous page-outs require moving the data to the physical swap devices or swap files. Linux uses the term swapping to refer to this type of paging.
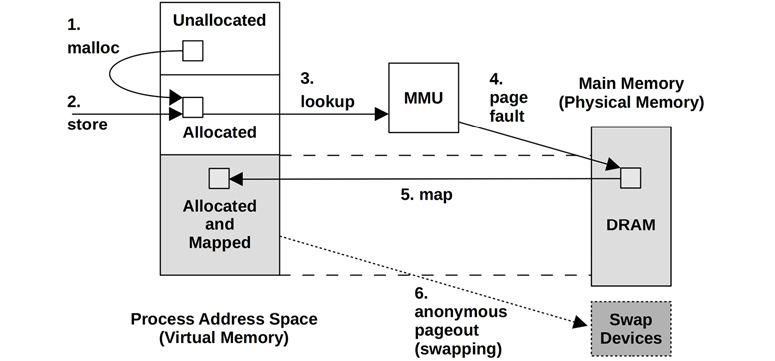
Demand Paging
Operating systems that support demand paging (most do) map pages of virtual memory to physical memory on demand. This defers the CPU overhead of creating the mappings until they are actually needed and accessed, instead of at the time a range of memory is first allocated.
If the mapping can be satisfied from another page in memory, it is called a minor fault. Page faults that require storage device access (not shown in this figure), such as accessing an uncached memory-mapped file, are called major faults.
States of a page in virtual memory: A. Unallocated B. Allocated, but unmapped (unpopulated and not yet faulted C. Allocated, and mapped to main memory (RAM) D. Allocated, and mapped to the physical swap device (disk)
Resident set size (RSS): The size of allocated main memory pages (C)
Virtual memory size: The size of all allocated areas (B + C + D)
Overcommit
Linux supports the notion of overcommit, which allows more memory to be allocated than the system can possibly store—more than physical memory and swap devices combined. It relies on demand paging and the tendency of applications to not use much of the memory they have allocated.
Process Swapping
Process swapping is the movement of entire processes between main memory and the physical swap device or swap file.
File System Cache Usage
It is normal for memory usage to grow after system boot as the operating system uses available memory to cache the file system, improving performance. The principle is: If there is spare main memory, use it for something useful.
Utilization and Saturation
Main memory utilization can be calculated as used memory versus total memory. Memory used by the file system cache can be treated as unused, as it is available for reuse by applications. If demands for memory exceed the amount of main memory, main memory becomes saturated.
Allocators
While virtual memory handles multitasking of physical memory, the actual allocation and placement within a virtual address space are often handled by allocators.
Shared Memory
Memory can be shared between processes. This is commonly used for system libraries to save memory by sharing one copy of their read-only instruction text with all processes that use it.
Proportional set size (PSS)
Private memory (not shared) plus shared memory divided by the number of users.
Working Set Size
Working set size (WSS) is the amount of main memory a process frequently uses to perform work.
Word Size
Processors may support multiple word sizes, such as 32-bit and 64-bit, allowing software for either to run. As the address space size is bounded by the addressable range from the word size, applications requiring more than 4 Gbytes of memory are too large for a 32-bit address space and need to be compiled for 64 bits or higher.